



China Beer Factory QA Systems: How Real-Time pH Monitoring and Spectrophotometric Color Analysis Prevent Batch Rejection
Time : Aug 31, 2026
For quality assurance professionals working in a China beer factory, batch rejection isn’t just about scrap volume or rework cost—it’s the first visible crack in your credibility with global retailers, foodservice partners, and certification auditors. When a pallet of German wheat beer fails color consistency at a European supermarket’s incoming inspection—or when a low-calorie variant triggers pH drift during shelf-life validation—the root cause is rarely microbial contamination or raw material failure. More often, it’s a silent gap between lab sampling frequency and process reality. At Jinpai Beer, we’ve seen this firsthand across 12+ product lines—from classic lagers to functional specialty beers—and rebuilt our QA backbone around two non-negotiable tools: real-time pH monitoring at fermentation and post-filtration, and spectrophotometric color analysis at packaging. Not as add-ons. Not as annual audit checklists. As live control points that feed actionable thresholds—not just data.
Let’s be clear: pH and color aren’t “nice-to-have” metrics in modern craft beer production. They’re proxies for stability, safety, and sensory integrity—especially in a China beer factory scaling across styles with divergent fermentation profiles, adjunct loads, and stabilization methods. A classic lager may hold stable pH between 4.2–4.4 through cold storage, but a fruit-flavored beer with added citric acid and enzymatic haze inhibitors can shift 0.3 units in 72 hours if post-fermentation pH isn’t actively tracked. That drift doesn’t always trigger spoilage—but it *does* accelerate Maillard reactions, alter hop iso-alpha acid solubility, and destabilize anthocyanin-based colorants. In practice, that means a batch passing lab tests on Day 1 may show visible haze or flavor flattening by Day 15—and fail at the distributor’s warehouse before it ever hits the bar tap.
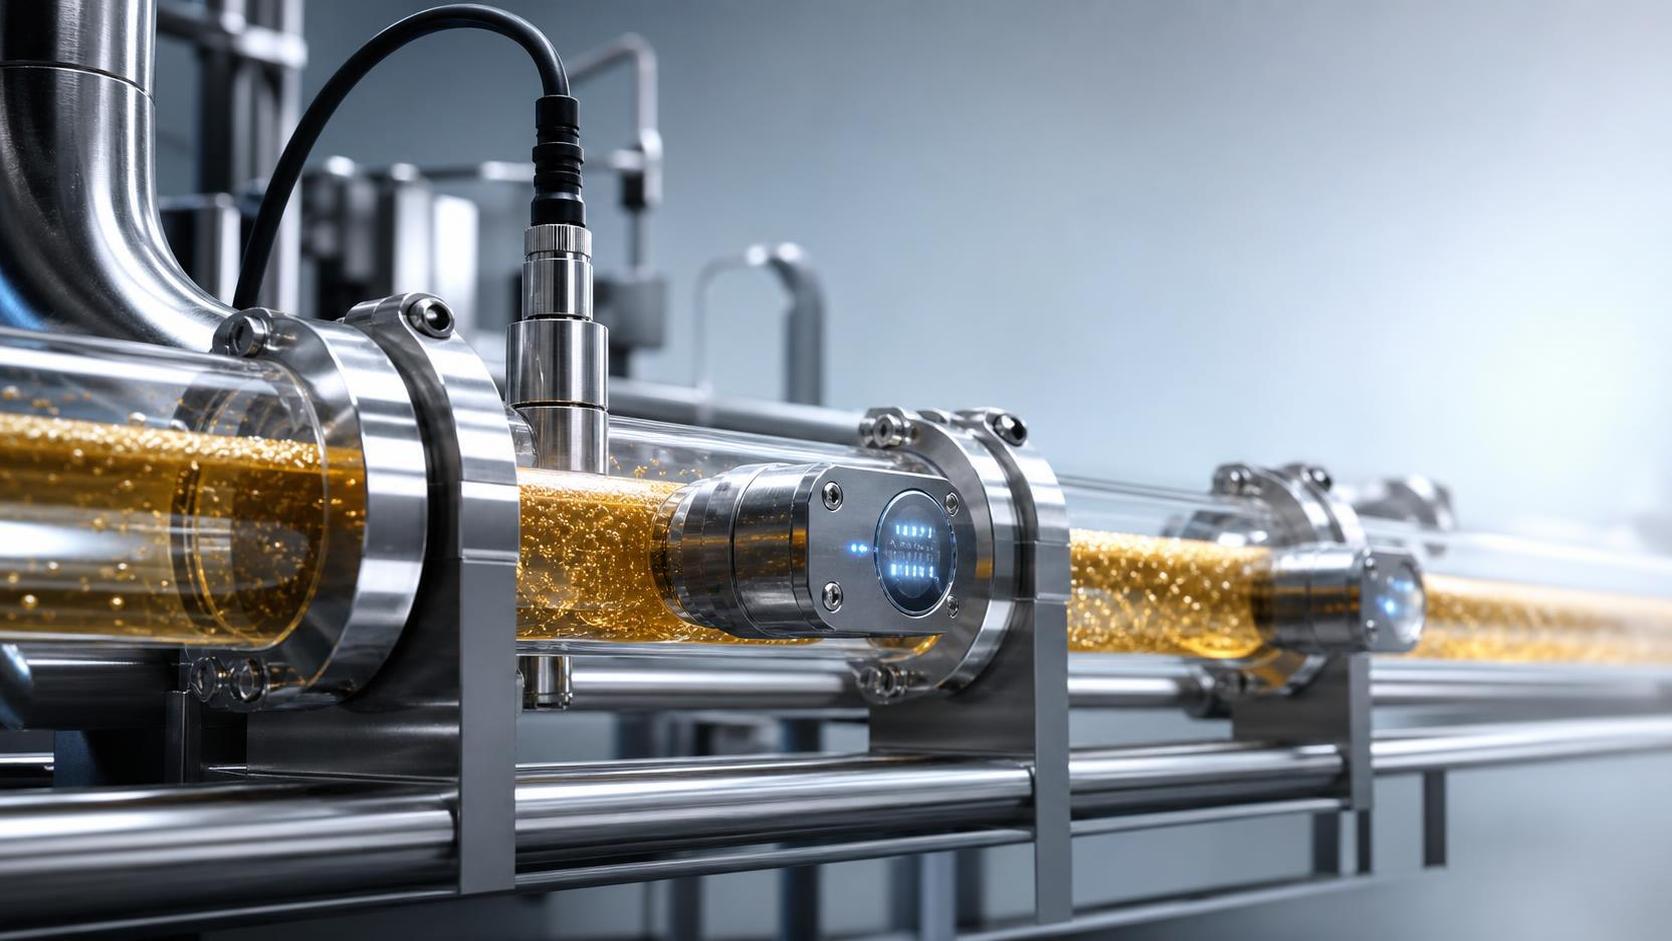
That’s why we moved pH monitoring from offline titration (every 4–6 hours, per tank) to continuous in-line sensors with auto-calibration cycles tied to CIP events. These aren’t generic industrial probes. They’re food-grade, double-junction electrodes rated for high-turbidity wort and low-alcohol finished beer, mounted directly in recirculation loops pre- and post-plate heat exchanger. The system logs every reading at 90-second intervals, flags deviations >±0.08 from target (e.g., 4.32 ±0.05 for our sugar-free low-calorie line), and pauses downstream transfer if three consecutive readings breach threshold. This isn’t about stopping production—it’s about catching drift *before* it compounds. We’ve cut pH-related holds by 68% since implementation, not because our process got “more stable,” but because we stopped relying on human timing and started trusting process rhythm.
Color is trickier. Visual assessment under daylight bulbs? Unreliable—even for trained staff. Densitometers calibrated for paper? Useless for translucent, carbonated liquid with suspended yeast or fruit pulp. What works is spectrophotometry—not as a final QC gate, but as an inline checkpoint *after* centrifugation and *before* sterile filtration. We use a 360–740 nm reflectance spectrophotometer with integrated temperature compensation (critical: beer at 4°C vs. 12°C reads differently even at same EBC value), measuring against NIST-traceable ceramic standards—not air or water blanks. Each batch gets scanned every 8 minutes during filling; the system calculates delta-E against master reference spectra for that specific SKU. For German wheat, tolerance is ±1.2 EBC units; for hazy IPA variants, it’s ±2.8—because turbidity variance is part of the style specification, not a defect. Crucially, the software correlates color shifts with concurrent pH trends. A simultaneous rise in both often signals early oxidation—not something you’d catch with sensory panels until week 3.
Here’s what most QA teams underestimate: these systems don’t replace judgment—they sharpen it. Real-time pH curves reveal subtle fermentation stalls that GC-MS won’t flag for days. Spectral fingerprints expose carryover from previous batches in shared lines (e.g., residual raspberry pigment shifting the baseline of a subsequent pilsner). And when a functional specialty beer with added B vitamins shows unexpected UV absorbance at 280 nm, the color analyzer flags it *before* blending—saving us from a stability failure that would’ve required full reformulation.
This isn’t theoretical. Last quarter, our OEM partner for a Southeast Asian hotel chain flagged inconsistent amber tones in their house lager. Lab reports showed all specs “in range.” But our spectrophotometric log revealed a 0.9 EBC drift correlated precisely with a new malt supplier’s kilning profile—undetectable via standard Lovibond but clear in spectral slope between 450–520 nm. We adjusted mash pH targets by 0.15 units, stabilized color, and avoided a contract renegotiation. That’s the difference between reactive troubleshooting and anticipatory control.
None of this works without context. A China beer factory producing single-style lagers at 20,000 HL/year needs different sensor density than one running 8 SKUs daily across 3 fermentation halls. Our setup assumes multi-style flexibility: modular probe housings compatible with 2”–6” sanitary lines, cloud-synced dashboards accessible to shift supervisors (not just lab managers), and calibration protocols validated against AOAC Method 985.21 for beer pH and ASBC Method Beer-10b for color. We don’t retrofit legacy tanks—we design sensor ports into new vessels from day one.
Also worth noting: this approach has limits. It won’t catch diacetyl spikes missed during maturation. It won’t identify rogue wild yeast in barrel-aged variants. And it absolutely cannot compensate for inconsistent CIP efficacy—if your caustic concentration drops below 1.8%, biofilm buildup will skew both pH and color baselines within 48 hours. So yes, we run ATP swabs weekly. Yes, we verify sanitizer residuals. Real-time analytics only amplify good fundamentals—they don’t replace them.
For QA leads evaluating systems, ask three questions before investing:
1. Does the pH sensor tolerate repeated thermal cycling *and* high-solids wort without recalibration drift? (Many fail here.)
2. Can the color system handle carbonated, non-filtered beer *without* degassing or dilution? (If it requires sample prep, it’s not real-time.)
3. Are deviation alerts tied to *process actions*—not just email notifications? (Pause transfer. Flag tank. Auto-generate deviation report for internal audit.)
At Jinpai Beer, these tools are embedded in how we think—not just what we measure. They let us ship consistent German wheat to Berlin bars, stable low-calorie lagers to Tokyo convenience stores, and vibrant fruit-beers to Australian cafes—all from the same production floor, same QA team, same confidence. Because in a China beer factory serving global channels, reliability isn’t built in the lab. It’s built in the loop.
China beer factory operations thrive not on uniformity, but on disciplined responsiveness—and that starts where chemistry meets control.
Jin Pai Beer Co., Ltd
Thank you very much for writing to us. Please leave your message and contact information, we will reply to you within 24 hours.