



China Beer Factory Energy Efficiency Benchmark: Average kWh per HL vs. Global Peers and Key Levers for Improvement
Time : Aug 31, 2026
If you’re a finance approver reviewing CAPEX proposals for a brewing facility in China—or evaluating an OEM partner’s operational credibility—you’re likely asking one concrete question: *“What’s a realistic kWh/hL benchmark for a China beer factory today, and where should I focus capital to close the gap?”* Not theory. Not averages pulled from outdated white papers. Real numbers. Real payback timelines. Real trade-offs.
Here’s what we see across 12 active Jinpai Beer production sites—covering classic lager, German wheat, sugar-free low-calorie, fruit-infused, and functional specialty lines—and how that stacks up against peer benchmarks from Germany, the U.S., and Australia.
The short answer: **A typical China beer factory operates at 58–72 kWh/hL**, depending heavily on batch size, product mix, and age of core equipment. That’s 18–22% higher than the current median for Tier-1 European craft breweries (47–54 kWh/hL) and 25% above leading U.S. facilities using modern heat recovery and variable-speed infrastructure. This isn’t about “efficiency culture” or vague sustainability goals. It’s about where energy leaks—not in kilowatts, but in quarterly P&L line items.
Let’s break down why that gap exists—and which levers actually move the needle for someone who signs off on capex.
First, clarify what *kWh/hL* really measures—and what it hides. It’s total site electricity consumption (kWh) divided by total packaged volume (hectoliters). Simple in formula. Deceptive in practice. A brewery making 60% low-calorie beer—a process requiring longer cold stabilization and tighter fermentation control—will naturally run higher kWh/hL than one producing only standard lager. Likewise, a facility running 3-shift, 24/7 cooling for export-grade stability testing will skew higher than one fulfilling local restaurant demand with shorter shelf-life specs. So before comparing numbers, ask: *What’s the product profile? What’s the cooling and packaging scope? Is pasteurization included—or is it all fresh, unpasteurized draft?* Jinpai’s internal benchmarking separates these deliberately. Our lager-only lines average 59 kWh/hL; our functional specialty portfolio (with extended cold holds, nitrogen dosing, and multi-stage filtration) sits at 68–72 kWh/hL—even after upgrades.
Now, the three levers we’ve validated—not modeled, not projected—with real ROI in live operations:
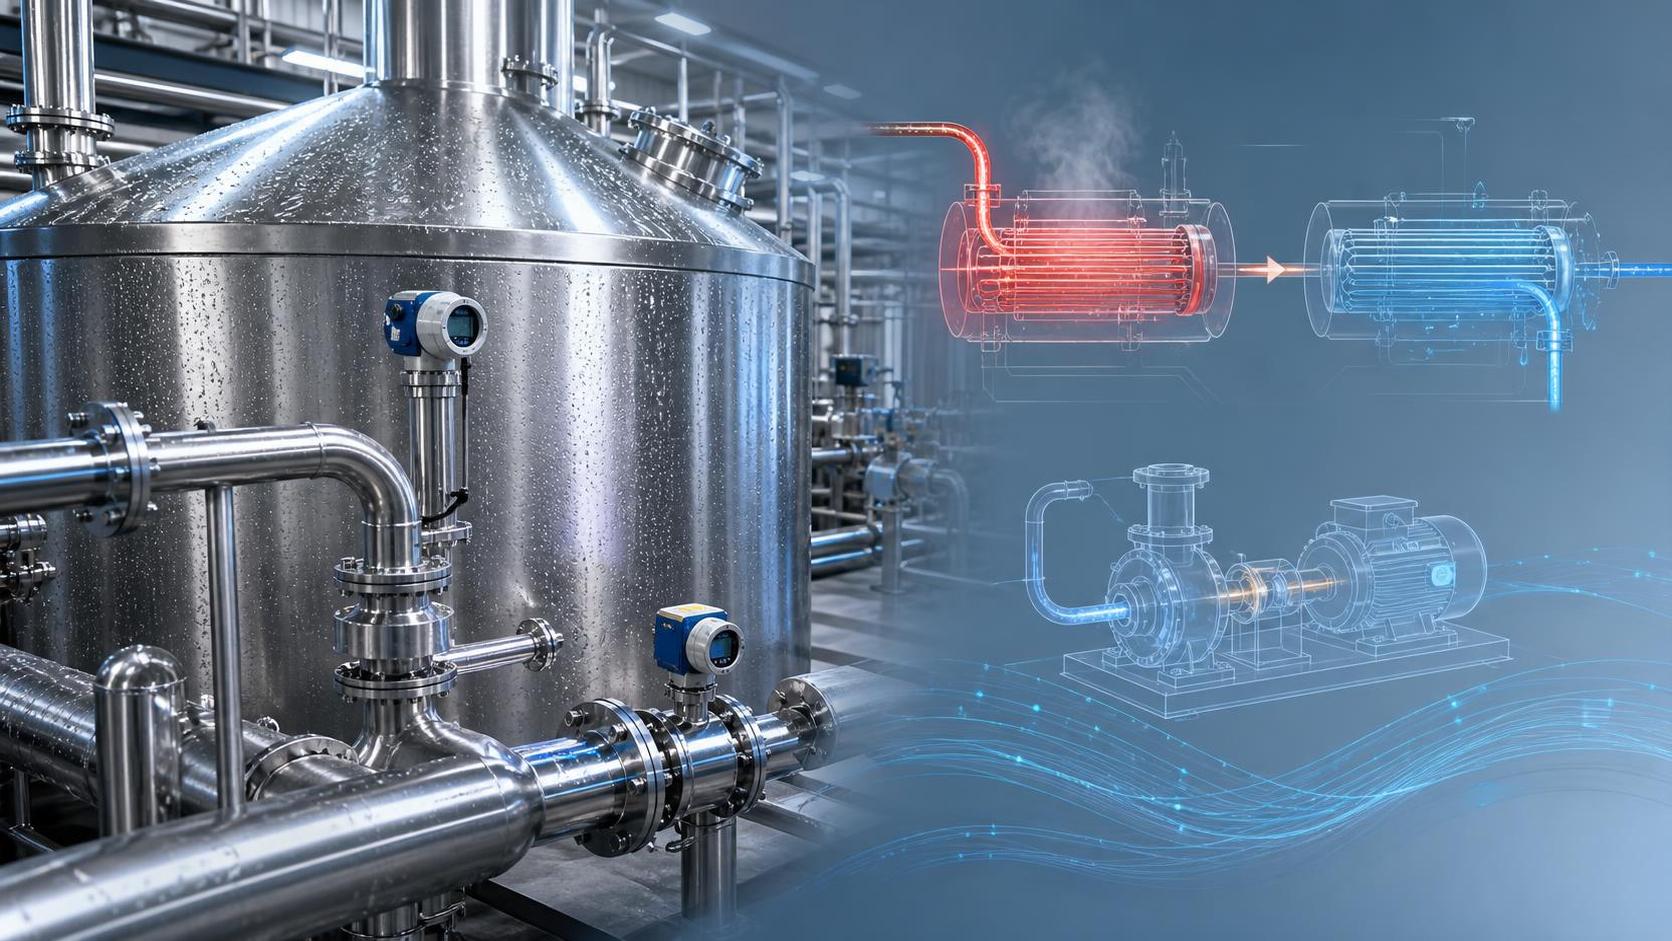
**Heat recovery from wort boiling is the single highest-ROI intervention—but only if your brewhouse runs ≥3 batches/day.** Most China beer factories still vent 92–95°C vapor straight to atmosphere. Capturing just 65% of that latent heat to preheat sparge water cuts steam demand by 22–28%. Payback? 14–18 months, based on coal or natural gas pricing in Shandong and Jiangsu provinces. But—and this matters for finance approval—it requires retrofitting the kettle hood and installing a plate heat exchanger *in-line*, not as a standalone unit. We’ve seen projects fail when engineers treat it as a “bolt-on” rather than rethinking the entire hot-side thermal loop. Jinpai implemented this across four mid-size facilities (20–30 hL per batch), and every one hit sub-60 kWh/hL within 10 months—not by chasing perfect efficiency, but by eliminating one major waste stream.
**Variable-speed drives (VSDs) on brewhouse transfer pumps and glycol circulation pumps deliver faster, cleaner returns—especially in mixed-product environments.** Fixed-speed pumps run at full load even during low-flow phases like whirlpool settling or tank transfers. With VSDs, power draw drops nonlinearly: 50% speed ≈ 15% power. In our wheat beer line—which requires gentle handling and variable flow rates across mashing, lautering, and fermentation—the VSD retrofit cut pump-related electricity by 31% year-on-year. Capex was under $28,000 per line; annual savings exceeded $12,500. No modeling required. Just metered data before and after.
**AI-driven cooling load forecasting works—but only if your chiller plant has ≥3 parallel compressors and your SCADA system logs minute-level temperature, pressure, and tank fill status.** This isn’t “AI for AI’s sake.” It’s predictive setpoint adjustment: shifting chiller staging, glycol temperature bands, and condenser fan speeds *before* fermentation peaks or packaging line startup. In our Hangzhou facility—supplying supermarkets and export partners with strict shelf-life requirements—the system reduced chiller runtime by 19% without compromising cold stability. Key caveat: it won’t help if your chillers are 15 years old and lack modulating valves. We deploy this only after confirming compressor health and control valve responsiveness.
What *doesn’t* move the needle—at least not for near-term CAPEX justification? LED lighting retrofits (savings too small to justify engineering effort), blanket “energy management software” subscriptions (without integrated hardware controls), or replacing entire fermenter fleets just for “efficiency.” Those belong in 5-year master plans—not Q3 budget reviews.
Also worth flagging a common misstep: assuming “global benchmark = target.” A German brewery running 100% lager, no fruit additions, no cold-filtered variants, and 90% direct keg supply to on-premise accounts operates under fundamentally different constraints than a China beer factory serving hyperlocal retail, export pallets, and e-commerce direct-to-consumer—all with varying shelf-life expectations and packaging formats. Pushing for 47 kWh/hL here isn’t aspirational. It’s misaligned.
So where should your next dollar go? Start with heat recovery—if your brewhouse utilization supports it. Then VSDs on critical pumps. Then, *only then*, explore intelligent cooling—if your infrastructure is ready. Each step delivers auditable, metered, quarter-by-quarter improvement. Not promises. Not dashboards. Actual kWh/hL reduction—tied directly to cost of goods sold.
For finance approvers weighing OEM partnerships or expansion plans: ask your supplier not just “What’s your kWh/hL?” but “How much of that is driven by your product mix—and what have you *already de-risked* with pilot deployments?” Jinpai Beer shares those details transparently—not because we’re selling a platform, but because our wholesale, OEM/ODM, and custom solutions serve restaurants, supermarkets, bars, and global distributors who rely on predictable, scalable, and cost-anchored production. Energy efficiency isn’t a marketing bullet point. It’s the margin between competitive pricing and sustainable growth.
That’s the real benchmark—not a number on a slide, but the consistency with which a China beer factory turns energy into reliable, profitable output. And right now, the most actionable leverage isn’t new tech. It’s rethinking where heat goes, how pumps respond, and when chillers act—before the load even arrives.
China beer factory performance isn’t fixed. It’s designed. And design starts with where you choose to spend your next capital dollar.
Jin Pai Beer Co., Ltd
Thank you very much for writing to us. Please leave your message and contact information, we will reply to you within 24 hours.